#TheSDGVizProject Goal 4

The Sustainable Development Goals - Goal 4 looks at quality education.
What are the Sustainable Development Goals?
The
Sustainable Development Goals
(SDG’s) were created and adopted by all UN Member States in 2015 as part of a
15-year plan to end poverty, protect the planet, and improve the lives and
prospects of all persons. Although there has been incredible progress
over the last 5 years, the speed and scale is not enough to meet those goals
by 2030.
What is #TheSDGVizProject?
The Tableau community initiative was started by
Brian Moore,
Jacqui Moore
and
Vinodh Kumar to help raise awareness of the Sustainable Development Goals. You can read more
about it on their website.
Goal 4
- Quality education for all
Goal 4 looks to ensure inclusive and equitable quality education and promote
lifelong learning opportunities for all.
Here are some statistics on education from the United Nations:


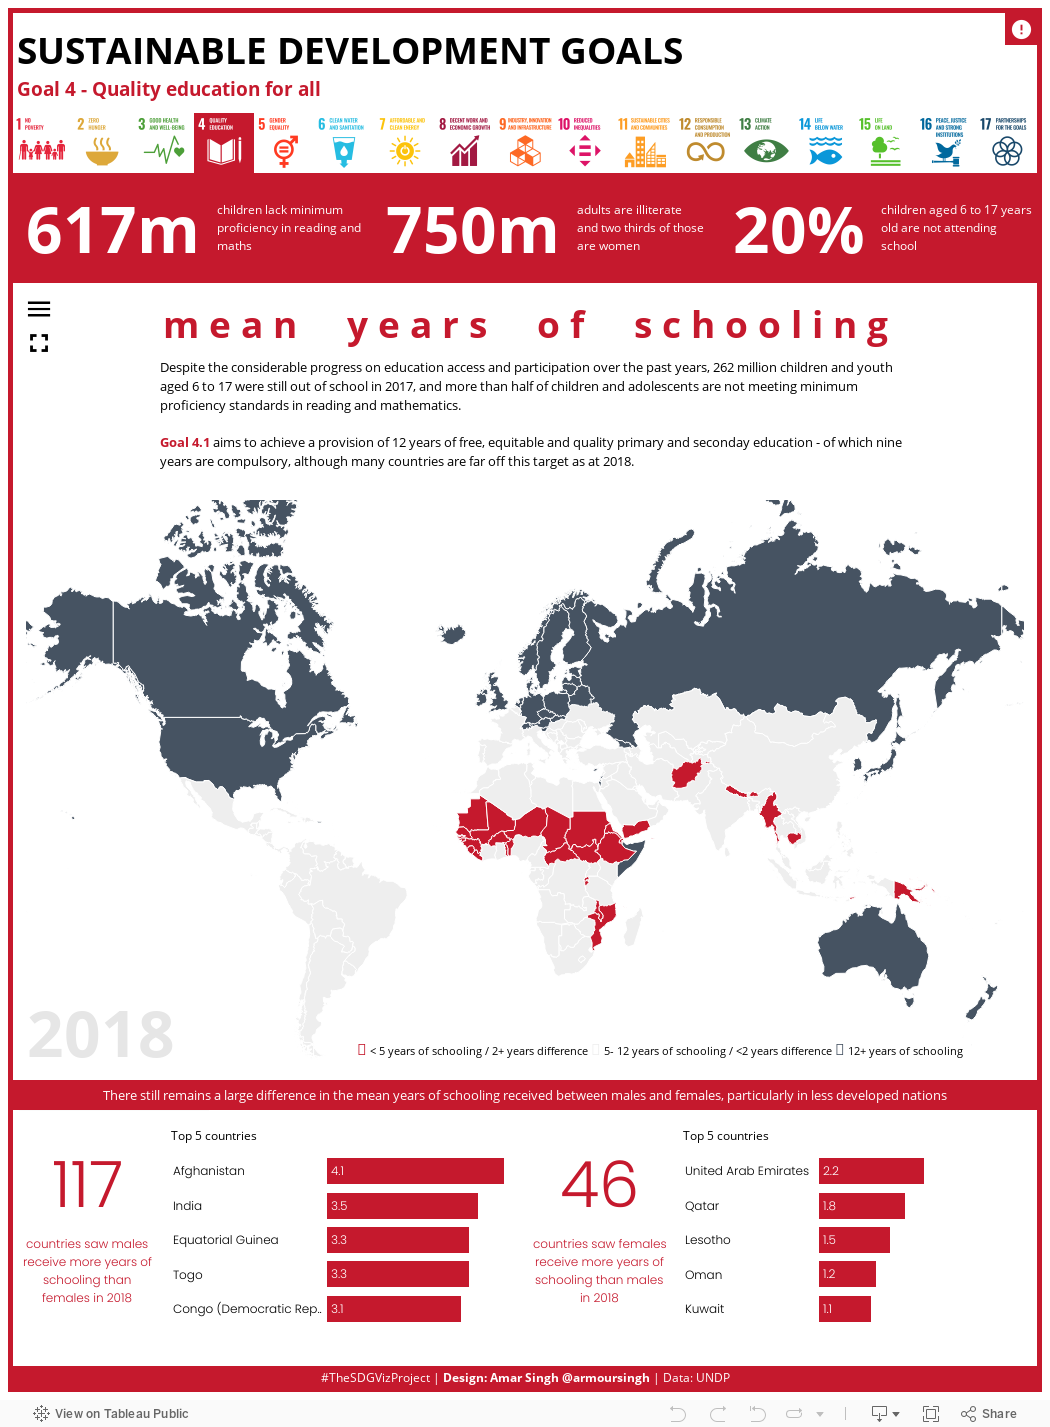
- 617 million children and adolescents lack minimum proficiency in reading and mathematics
- More than 50% of schools in Sub-Saharan Africa do not have access to basic drinking water, hand-washing facilities, internet access, or computers
- 750 million adults are illiterate and two thirds of those are women
- Worldwide, 1 out of 5 children aged 6 to 17 years old are not attending school
- Roughly 50% of primary school aged children who are not attending school, live in conflict affected areas
- In Central Asia, 27% more girls than boys of primary school age are not attending school
The theme
It was fairly difficult to decide on a theme and dataset to work with. I
opted to look at mean years of schooling around the world as its evident
that not all children have the opportunity to start and complete education
equally across the globe. Goal 4.1 aims to provide children with at least
12 years of free, quality education - of which 9 years are compulsory.
The data
The data was downloaded from the United Nations Development Programme
Human Development Reports. I downloaded three datasets, one for each sex and one for the totals,
and then unioned and pivoted the data in Tableau
Layout
I've been following a consistent template for my #TheSDGVizProject
submissions so the layout was fairly simple to follow.
Click the images to be taken to the respective dashboards on Tableau Public.
The icons at the top represent each of the 17 SDGs with a row underneath
showing some headline statistics.
Map
The map shows the mean years of schooling. A
parameter is used to select:
- Mean years of schooling (all sexes)
- Mean years of schooling (females)
- Mean years of schooling (males)
- Differences in mean years of using (males - female)
The colours are as follows:
- Red: less than, or equal to, 5 years of schooling OR where the difference between males and females is greater than 2 years
- Light grey: between 5 and 12 years of schooling OR where the difference between males and females is less than 2 years
- Dark grey: 12 or more years of schooling
Dumbbell Chart
The dumbbell chart was used to highlight the differences in years of
schooling between males and females, by country.
The chart is sorted using a calculated field driven by a parameter.
Differences in years of schooling
The four worksheets at the bottom of the viz show, for the selected year:
- The number of countries where males received more years of schooling compared to females
- The top five countries where this occurred
- The number of countries where females received more years of schooling compared to males
- The top five countries where this occurred
Putting it together
The worksheets are put together using tiled containers, except for the
dumbbell chart which is floating. The dumbbell chart sits inside a
container to allow a show/hide button to be used, this allows the user to
show and hide the dumbbell chart.
The filter panel is also in a floating container and assigned to a
show/hide button.
You can interact with the viz below or
view on my Tableau Public profile.