Workout Wednesday #WOW2020 W20
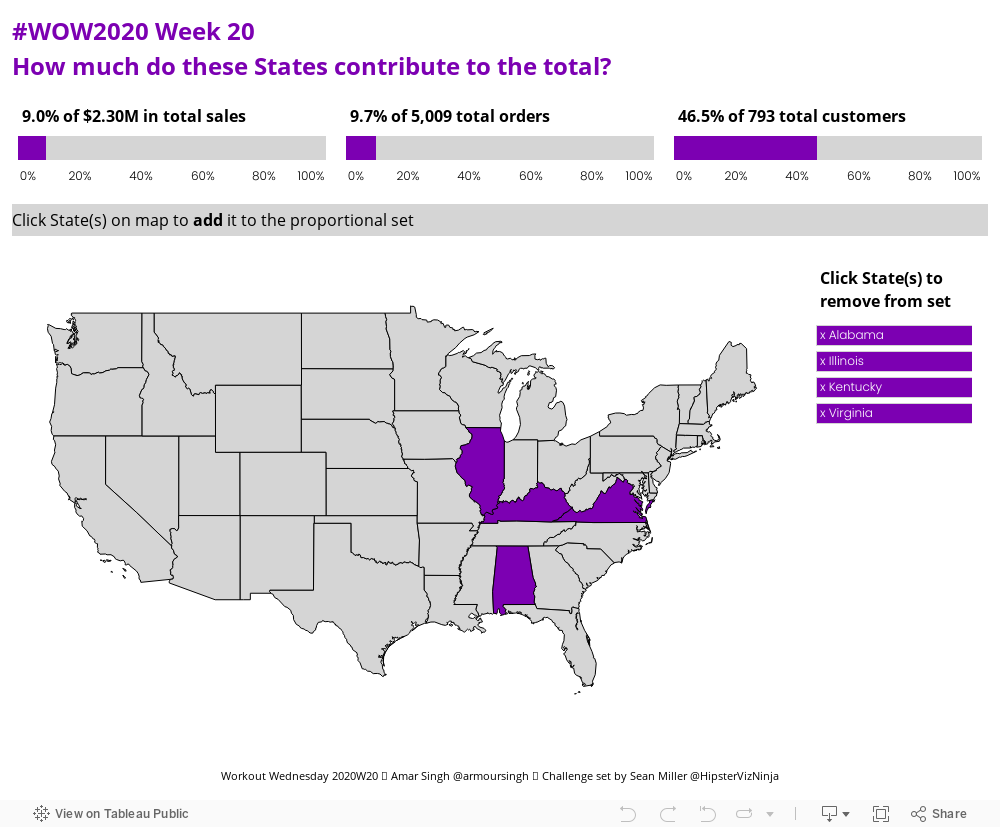

This challenge by Sean Miller
uses Set Actions to add and remove States to a Set using the map and side
panel.
It was a good intro to a feature I can definitely see myself using in the
workplace. The steps I took are below.
Creating the Set
Create a Set from the States field. Unlike previous
versions of Tableau, this now appears in the Tables (formerly Dimensions)
pane.

Creating the map
Use the State field (not the Set) to generate the map and
hide all layers, names, etc., from the Map Options menu.
The State Set is used in the
colour pane.
You'll notice a 0 field in the
Marks pane, I'll come to that
later.

Creating the viz for showing the selected States
I went with a bar chart. I used a generic field of
MAX(1) to size the bar and
edited the label to add 'x' in front of the State name.

Creating the KPIs
There were 3 KPIs to create, one for Sales, Orders and Customers. They all
followed a similar approach and needed to show the % contribution by the
selected States, their contributed value and the total value.
These are the formulas I used.
Sales
Sales 002
= INT(REPLACE([Sales], '$',''))
Sales Value = { SUM(IF
[State Set] THEN [Sales 002] END) }
Total Sales = { FIXED :
SUM([Sales 002]) }
% of sales = {SUM(IF [State Set] THEN [Sales 002] END)} / {SUM([Sales 002])}
Orders
Orders = { COUNTD(IF
[State Set] THEN [Order ID] END) }
Total Orders = { FIXED :
COUNTD([Order ID]) }
% of orders = { COUNTD(IF
[State Set] THEN [Order ID] END) } / {COUNTD([Order ID])}
Customers
Customers = { COUNTD(IF
[State Set] THEN [Customer Name] END) }
Total Customers = { FIXED
: COUNTD([Customer Name]) }
% of customers = { COUNTD(IF
[State Set] THEN [Customer Name] END) } / {COUNTD([Customer Name])}
Tooltips
Update tooltips as per original viz in the challenge.
Create dashboard and add actions
Once the dashboard was built I added the three dashboard actions.
Map to Set
This action adds values to the
State Set when a State is
selected on the Map. The issue with this interactivity is that when a State is
selected, it is also highlighted and you need to select it again to remove the
highlighting.

To use this create two calculated fields,
[0] with a value of 0 and
[1] with a value of 1. Place
the 0 field into the Maps
sheet and set it as a discrete dimension. Then apply the Clear Map dashboard
action below.

Clear Map
This action automatically deselects a selected State on the map. It is because
you are trying to filter on a value that doesn't exist, causing the map
highlighting to reset (or at least that's how I interpret it!).
Clear Set
This dashboard action removes the States from the
State Set upon selecting an
item in the list.
Finalise dashboard
Apply remaining formatting to titles, etc.
Interact with the dashboard below or
click here
to view on my profile.