#MakeoverMonday 2020W21 v2

I decided to have a bit of fun for this week's
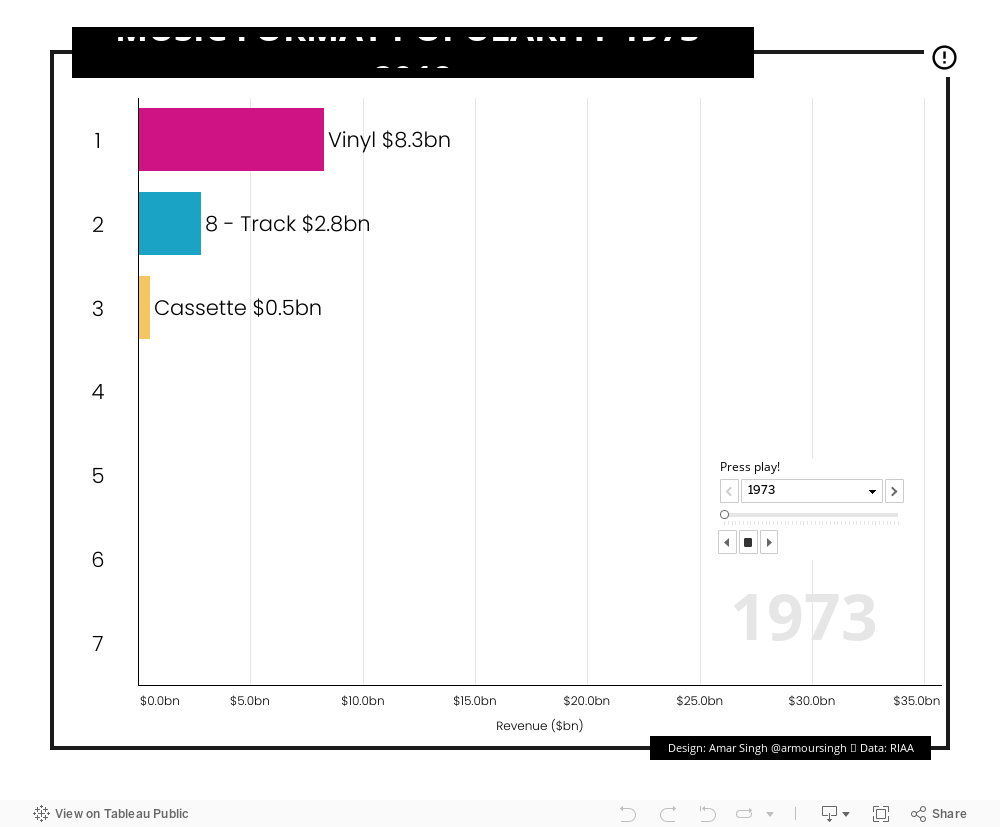
Makeover Monday and created a racing bar chart in addition to my other
viz.
Calculated Fields/Groups
I created one group and two calculated fields, two of which were from my other
entry which you can read about
here.
- A [Value in Bn] field to convert the units to billions (see post)
- A [Format (group)] group to group formats into categories (see post)
- A [Rank] field which ranks the formats in order of revenue generated (or [Value in Bn]).
- This used the formula RANK_UNIQUE(SUM([Value (Actual)]))
The Viz
To create the viz, do the following:
- Place the [Year] field into the Pages pane. This is what allows you to cycle through each year using the 'play' button on the dashboard
- Add [Format (group)] into Colour on the Marks pane
- Place the [Rank] field into Rows and set it to Discrete.
- Right click > Compute Using > [Format (group)]
- Place [Format (group)] into Label on the Marks pane
- Place [Value in Bn] into Label on the Marks pane
- Place [Metric] into Filters and select Value (Adjusted)

Warning: If you add
[Format (group)] into the Rows pane then you
will end up showing all formats for all ranks which will make for a long
list with empty values where you expect bar charts. Therefore adding it as
a label works around this issue. An example of what you don't want is below:

Finally, add [Rank] to the Filter pane and set
it to show non-null values.

Year text
On the bottom-right of the viz, the year is displayed.
To create this I created a new worksheet and added [Year] to the title. The [Year] field was also placed in the Pages pane.
INT(NULL) is just a way to hide the Abc text you get when you
use the Text option in the marks pane but don't have any values to show.

The Dashboard
On the dashboard, position the worksheets as required (the year worksheet
was floating) and select 'Show Page Control' on one of the worksheets in the
worksheet menu.
To allow both worksheets to change as the Page cycles through each year,
select 'Synchronised' on the Page Control menu.

The speed of the Page Control is up to you, but note that it will be
slightly slower on Tableau Public than you see on Tableau Desktop.
Finally, enable viz animations in the Format menu. You can customise the viz
animations to your liking, though again the speed on Tableau Public will be
slightly slower than what you see on Tableau Desktop.

Final output
You can interact with the dashboard below or
view on my Tableau Public profile.